New Firefox HTTP cache now enabled on Nightly builds

Yes, it's on!  After a little bit more than a year of a development by me and Michal Novotný all bugs we could find in our labs, offices and homes were fixed.  The new cache back-end is now enabled on Firefox Nightly builds as of version 32 and should stay like that.

The old cache data are for now left on disk but we have handles to remove them automatically from users' machines to not waste space since it's now just a dead data.  This will happen after we confirm the new cache sticks on Nightlies.

The new HTTP cache back end has many improvements like request prioritization optimized for first-paint time, ahead of read data preloading to speed up large content load, delayed writes to not block first paint time, pool of most recently used response headers to allow 0ms decisions on reuse or re-validation of a cached payload, 0ms miss-time look-up via an index, smarter eviction policies using frecency algorithm, resilience to crashes and zero main thread hangs or jank.  Also it eats less memory, but this may be subject to change based on my manual measurements with my favorite microSD card which shows that keeping at least data of html, css and js files critical for rendering in memory may be wise.  More research to come.

Thanks to everyone helping with this effort.  Namely Joel Maher and Avi Halachmi for helping to chase down Talos regressions and JW Wang for helping to find cause of one particular hard to analyze test failure spike.  And also all early adopters who helped to find and fix bugs.  Thanks!


New preferences to play with:


browser.cache.disk.metadata_memory_limit
Number of kBs we reserve for keeping recently loaded cache entries metadata (i.e. response headers etc.) for quick access and re-validation or reuse decisions.  By default this is at 250kB.
browser.cache.disk.preload_chunk_count
Number of data chunks we always preload ahead of read to speed up load of larger content like images.  Currently size of one chunk is 256kB, and by default we preload 4 chunks - i.e. 1MB of data in advance.


Load times compare:

Since these tests are pretty time consuming and usually not very precise, I was only testing with page 2 of my blog that links some 460 images.  Media storage devices available were: internal SSD, an SDHC card and a very slow microSD via a USB reader on a Windows 7 box.


[ complete page load time / first paint time ]

SSD
Cache versionFirst visitCold go to 1)Warm go to 2)Reload
cache v17.4s / 450ms880ms / 440ms510ms / 355ms5s / 430ms
cache v26.4s / 445ms610ms / 470ms470ms / 360ms5s / 440ms


Class 10 SDHC
Cache versionFirst visitCold go to 1)Warm go to 2)Reload
cache v17.4s / 635ms760ms / 480ms545ms / 365ms5s / 430ms
cache v26.4s / 485ms1.3s / 450ms530ms / 400ms*5.1s / 460ms*


Edit: I found one more place to optimize - preload of data sooner in case an entry has already been used during the browser session (bug 1013587).  We are winning around 100ms for both first paint and load times!  Also stddev of first-paint time is smaller (36) than before (80).  I have also measured more precisely the load time for non-patched cache v2 code.  It's actually better.

Slow microSD
Cache versionFirst visitCold go to 1)Warm go to 2)Reload
cache v113s / 1.4s1.1s / 540ms560ms / 440ms5.1s / 430ms
cache v26.4s / 450ms1.7s / 450ms710ms / 540ms*5.4s / 470ms*
cache v2 (with bug 1013587)--615ms / 455ms*-

* We are not keeping any data in memory (bug 975367 and 986179) what seems to be too restrictive.  Some data memory caching will be needed.


"Jankiness" compare:

The way I have measured browser UI jank (those hangs when everything is frozen) was very simple: summing every stuck of the browser UI, taking more then 100ms, between pressing enter and end of the page load.


[ time of all UI thread events running for more then 100ms each during the page load ]

SSD
Cache versionFirst visitCold go to 1)Warm go to 2)Reload
cache v10ms600ms0ms0ms
cache v20ms0ms0ms0ms


Class 10 SDHC
Cache versionFirst visitCold go to 1)Warm go to 2)Reload
cache v1600ms600ms0ms0ms
cache v20ms0ms0ms0ms


Slow microSD
Cache versionFirst visitCold go to 1)Warm go to 2)Reload
cache v12500ms740ms0ms0ms
cache v20ms0ms0ms0ms


All load time values are medians, jank values averages, from at least 3 runs without extremes in attempt to lower the noise.


1) Open a new tab and navigate to a page right after the Firefox start.

2) Open a new tab and navigate to a page that has already been visited during the browser session.

 

Mozilla Firefox new HTTP cache is live!

mozilla firefox new http cache performance speed crash kill freeze


The new Firefox HTTP cache back-end that keeps the cache content after a crash or a kill and doesn't cause any UI hangs - has landed!


It's currently disabled by default but you can test it by installing Firefox Nightly (version 27) and enabling it. This applies to Firefox Mobile builds as well.  There is a preference that enables or disables the new cache, find it in about:config. You can switch it on and off any time you want, even during active browsing, there is no need to restart the browser to take the changes in effect:

browser.cache.use_new_backend

  • 0 - disable, use the old crappy cache (files are stored under Cache directory in your profile) - now the default
  • 1 - enable, use the brand new HTTP cache (files are stored under cache2 directory in your profile)

Other new preferences that control the cache behavior:

No longer used any new specific preferences.  We are now backward compatible with the old cache preferences.

browser.cache.memory_limit

  • number of kBs that are preserved in RAM tops to keep the most used content in memory, so page loads speed up
  • on desktop this is now set to 50MB (i.e. 51'200kB)


There are still open bugs before we can turn this fully on.  The one significant is that we don't automatically delete cache files when browser.cache.disk.capacity is overreached, so your disk can get flooded by heavy browsing.  But you still can delete the cache manually using Clear Recent History.

Enabling the new HTTP cache by default is planned for Q4/2013.  For Firefox Mobile it can even be sooner, since we are using the Android's context cache directory that is automatically deleted when the storage gets out of space.  Hence, we don't need to monitor the cache capacity our self on mobile.

Please report any bug you find during tests under Core :: Networking: Cache.


New Firefox HTTP cache backend - story continues

In my previous post I was writing about the new cache backend and some of the very first testing.

Now we've stepped further and there are significant improvements.  I was also able to test with more various hardware this time.

The most significant difference is a single I/O thread with relatively simple event prioritization.  Opening and reading urgent (render-blocking) files is done first, opening and reading less priority files after that and writing is performed as the last operation. This greatly improves performance when loading from non-warmed cache and also first paint time in many scenarios.

The numbers are much more precise then in the first post.  My measuring is more systematic and careful by now.  Also, I've merged gum with latest mozilla-central code few times and there are for sure some improvements too.

Here are the results, I'm using 50MB limit for keeping cached stuff in RAM.


[ complete page load time / first paint time ]

Old iMac with mechanical HDD
BackendFirst visitWarm go to 1)Cold go to 2)Reload
mozilla-central7.6s / 1.1s560ms / 570ms1.8s / 1.7s5.9s / 900ms
new back-end7.6s / 1.1s530ms / 540ms2.1s / 1.9s**6s / 720ms


Old Linux box with mechanical 'green' HDD
BackendFirst visitWarm go to 1)Cold go to 2)Reload
mozilla-central7.3s / 1.2s1.4s / 1.4s2.4s / 2.4s5.1s / 1.2s
new back-end7.3s/ 1.2s
or** 9+s / 3.5s
1.35s / 1.35s2.3s / 2.1s4.8s / 1.2s


Fast Windows 7 box with SSD
BackendFirst visitWarm go to 1)Cold go to 2)Reload
mozilla-central6.7s / 600ms235ms / 240ms530ms / 530ms4.7s / 540ms
new back-end6.7s / 600ms195ms / 200ms620ms / 620ms***4.7s / 540ms


Fast Windows 7 box and a slow microSD
BackendFirst visitWarm go to 1)Cold go to 2)Reload
mozilla-central13.5s / 6s600ms / 600ms1s / 1s7.3s / 1.2s
new back-end7.3s / 780ms
or** 13.7s / 1.1s
195ms / 200ms1.6 or 3.2s* / 460ms***4.8s / 530ms


To sum - most significant changes appear when using a really slow media.  For sure, first paint times greatly improves, not talking about the 10000% better UI responsiveness!  Still, space left for more optimizations.  We know what to do:

  • deliver data in larger chunks ; now we fetch only by 16kB blocks, hence larger files (e.g. images) load very slowly
  • think of interaction with upper levels by means of having some kind of an intelligent flood control


1) Open a new tab and navigate to a page when the cache is already pre-warmed, i.e. data are already fully in RAM.

2) Open a new tab and navigate to a page right after the Firefox start.

* I was testing with my blog home page.  There are few large images, ~750kB and ~600kB.  Delivering data to upper level consumers only by 16kB chunks causes this suffering.

** This is an interesting regression.  Sometimes with the new backend we delay first paint and overall load time.  Seems like the cache engine is 'too good' and opens the floodgate too much overwhelming the main thread event queue.  Needs more investigation.

*** Here it's combination of flood fill of the main thread with image loads, slow image data load it self and fact, that in this case we first paint after all resources on the page loaded - that needs to change.  It's also supported by fact that cold load first paint time is significantly faster on microSD then on SSD.  The slow card apparently simulates the flood control here for us.

Firefox detailed event tracer - about:timeline

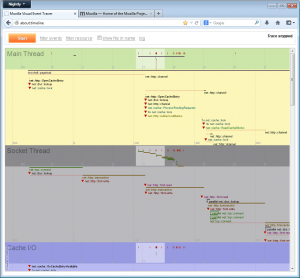
I always wanted to see all the little things that happen when loading a web page in Firefox.  I know how it works well as a Gecko developer, but to actually see the interaction and chaining is not at all always obvious, unless you study crazy NSPR logs.  Hence, I started a development of a tool, called event tracer, to get a timeline showing the hidden guts.

Example screenshot will tell the story the best way, a trial run of www.mozilla.org load:

firefox event timeline performance diagnostic tool

Planning improvements

At this time the work is not complete.  There is a lot more to make this an actually useful development tool and my next steps are to hunt those requirements down.

I am using about:timeline to verify patches I review do what they intend to do.  It can also help find hidden bugs.

However, using about:timeline for discovery of perfomance suboptimal code paths showed up being not that simple.  Events are just spread all over around and connection between them is not easily, if at all, discoverable.

Hence, this needs more thinking and work.

First thoughts to improve are to more focus on "the resource" and a single object dealing with it.  It might be better to show what all events are happening on e.g. a single instance of an http channel or http transactions then to tortuously hunt them somewhere in the graph.  There is some simple way to highlight and filter, but that is not enough for an analytical view.

Then, I'm missing a general way to easily recognize how things are chained together.  So, I'd like to link events that are coming one from another (like http channel creates an http transaction, then a connection etc.) and present the timeline more like a gantt chart plus show a critical path or flow for any selected pass through.

From inspecting the timeline it should be visible where bottlenecks and long wait times worth fixing are.  At this time I don't have a complete clear plan on this, though.


Still here?  Cool :)  If you have any though or ideas for how to use the data we collect and visualize as a valuable source for the performance optimization surgery please feel free to share them here.  More on how the timeline data are produced check bellow.


How it works

firefox event timeline performance diagnostic tool

This event track on the image is produced with a special code instrumentation.  To get for instance "net::http::transaction" traces, following 3 places of the code have been instrumented (in blue):


1. WAIT - record time when an http transaction is scheduled:

nsresult
nsHttpTransaction::Init(uint32_t caps,
                        nsHttpConnectionInfo *cinfo,
                        nsHttpRequestHead *requestHead,
                        nsIInputStream *requestBody,
                        bool requestBodyHasHeaders,
                        nsIEventTarget *target,
                        nsIInterfaceRequestor *callbacks,
                        nsITransportEventSink *eventsink,
                        nsIAsyncInputStream **responseBody)
{
    MOZ_EVENT_TRACER_COMPOUND_NAME(static_cast<nsAHttpTransaction*>(this),
                                   requestHead->PeekHeader(nsHttp::Host),
                                   requestHead->RequestURI().BeginReading());

    MOZ_EVENT_TRACER_WAIT(static_cast<nsAHttpTransaction*>(this),
                          "net::http::transaction");


2. EXEC - record time when the transaction first comes to an action, it is the time it gets a connection assigned and starts it's communication with the server:

void
nsHttpTransaction::SetConnection(nsAHttpConnection *conn)
{
    NS_IF_RELEASE(mConnection);
    NS_IF_ADDREF(mConnection = conn);

    if (conn) {
        MOZ_EVENT_TRACER_EXEC(static_cast<nsAHttpTransaction*>(this),
                              "net::http::transaction");
    }


3. DONE - record time when the transaction has finished it's job by completing the response fetch:

nsHttpTransaction::Close(nsresult reason)
{
    LOG(("nsHttpTransaction::Close [this=%x reason=%x]\n", this, reason));

    ...

    MOZ_EVENT_TRACER_DONE(static_cast<nsAHttpTransaction*>(this),
                          "net::http::transaction");
}

The thread timeline where an event is finally displayed is the thread where EXEC code has been called on.

What is the exact definition of the WAIT and EXEC phase is up to the developer now.  For me the WAIT phase is any time an operation is significantly blocked before it can be carried out, it's the time having the main performance affect we may be in particular interested in shortening.  Few examples:

  • time spent in a thread's event queue - duration from the dispatch to the run
  • time spent waiting for an asynchronous callback such as reading from disk or network
  • time waiting for necessary resources, such as an established TCP connection before an object can proceed with its job
  • time spent waiting for acquirement of a lock or a monitor

How to bind a URL or any identifying info to an event

The following instrumentation is used (in red):

nsresult
nsHttpTransaction::Init(uint32_t caps,
                        nsHttpConnectionInfo *cinfo,
                        nsHttpRequestHead *requestHead,
                        nsIInputStream *requestBody,
                        bool requestBodyHasHeaders,
                        nsIEventTarget *target,
                        nsIInterfaceRequestor *callbacks,
                        nsITransportEventSink *eventsink,
                        nsIAsyncInputStream **responseBody)
{
    MOZ_EVENT_TRACER_COMPOUND_NAME(static_cast<nsAHttpTransaction*>(this),
                                   requestHead->PeekHeader(nsHttp::Host),
                                   requestHead->RequestURI().BeginReading());

    MOZ_EVENT_TRACER_WAIT(static_cast<nsAHttpTransaction*>(this),
                          "net::http::transaction");


Here the http transaction event is set a host + path of the resource it loads.

The object's this pointer, that needs to be properly cast by the developer, is what sticks all together.  This is the main difference from how usual profiling tools work.  Event timeline is providing a view of event chaining crossing thread and method boundaries, and not just a pure stack trace.

View details of a tracked event

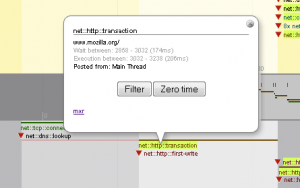
Each event track is bound with e.g. a URL it deals with, where applicable.  You can inspect the URL (the associated resource) and more details when an event is clicked on:

firefox event timeline performance diagnostic tool event detailWait between is track of the time the event spent waiting, i.e. the time the event has been scheduled and time of the execution start, both since the time tracking has been turned on.  The number in parentheses is simply the wait phase duration.

Execution is track of time spent by execution, i.e. when the intended job it self has started and when it has actually finished.  The parenthesized number is how long the job execution took.

Posted from is name of the thread the event has been scheduled at.

The Filter button is used to quickly filter this particular event plus it's sister events out.  How it work is described bellow.

The Zero time button is used to shift the "time 0.000" of the timeline to the start time of the inspected event, so that you can inspect recorded timing of other events relative to this one particular.

mxr link will open results of search for the event name in the code.  This way you can quickly inspect how this event timing is actually instrumented and collected right in the code.

Filtering timeline events

You can filter events using two filtering functions:

  • By type of an event (e.g. "net::nttp::transaction", "docshell::pageload" etc.)
  • By name of a resource an event has been associated with (e.g. "www.mozilla.org", "/favicon.ico" etc...)

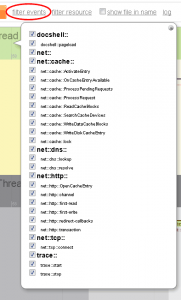
Filter by type - currently there are following event types so far implemented (instrumented).  Yyou get this check box list after the tracer run when you click filter events at the top bar:

firefox event timeline performance diagnostic tool event filterEach event has a namespace, e.g. for "net::http::transaction" the namespaces are "net::" and "net::http::".  You can turn on or off the whole set of events in a namespace easily.  Currently there are only "net::" and "docshell::" top level namespaces worth mentioning.


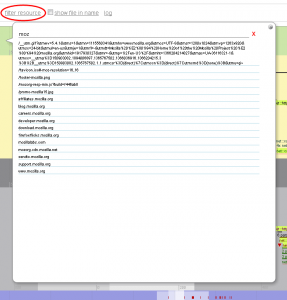
Filtering by resource, i.e. usually the URL a particular event or set of events have been bound to, is also possible when you click filter resource:

firefox event timeline performance diagnostic tool resource filter

You can enter the filter string manually or use the provided autocomplete.  The by-the-resource filtering works as follows:

1. we inspect whether the string set as the filter is a substring of the event resource string
2. we inspect whether the event resource string is a substring of the string set as the filter

If one of these conditions passes, we display the event, otherwise, we hide it.

This way when you enter "http://www.mozilla.org/favicon.ico" as a filter, you see the http channel and transaction for this resource load, as well as any DNS and TCP connection setups related to "www.mozilla.org".


How to use about:timeline your self

  • Create an optimized build of Firefox with --enable-visual-event-tracer configure option
  • Install about:timeline extension
  • Run Firefox
  • Go to about:timeline
  • Press the orange [ Start ] button, you get the message the trace is running
  • Proceed with your intended actions, e.g. a page load, and let it finish
  • Return to about:timeline tab and press the [ Stop ] button
  • Wait a little to get your events timeline details


So, here it is.  It's a work in progress tho.  I'll keep updates.

Firefox 23 now has faster localStorage implementation

Finally, the more efficient implementation of localStorage DOM API has landed and sticks in Firefox 23, currently on the Nightly channel.  The first build having the patches has id 20130416030901.

More about the motivation and details in my previous post on DOM storage code overhaul.

I want to thank all involved people, namely Vladan Djeric, Marco Bonardo and Olli Pettay for their help, ideas and mainly reviews of this large change.  Thanks!