I always wanted to see all the little things that happen when loading a web page in Firefox. I know how it works well as a Gecko developer, but to actually see the interaction and chaining is not at all always obvious, unless you study crazy NSPR logs. Hence, I started a development of a tool, called event tracer, to get a timeline showing the hidden guts.
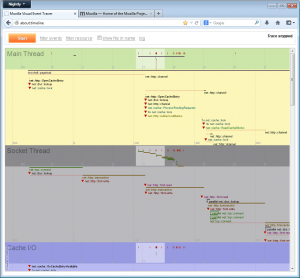
Example screenshot will tell the story the best way, a trial run of www.mozilla.org load:
Planning improvements
At this time the work is not complete. There is a lot more to make this an actually useful development tool and my next steps are to hunt those requirements down.
I am using about:timeline to verify patches I review do what they intend to do. It can also help find hidden bugs.
However, using about:timeline for discovery of perfomance suboptimal code paths showed up being not that simple. Events are just spread all over around and connection between them is not easily, if at all, discoverable.
Hence, this needs more thinking and work.
First thoughts to improve are to more focus on "the resource" and a single object dealing with it. It might be better to show what all events are happening on e.g. a single instance of an http channel or http transactions then to tortuously hunt them somewhere in the graph. There is some simple way to highlight and filter, but that is not enough for an analytical view.
Then, I'm missing a general way to easily recognize how things are chained together. So, I'd like to link events that are coming one from another (like http channel creates an http transaction, then a connection etc.) and present the timeline more like a gantt chart plus show a critical path or flow for any selected pass through.
From inspecting the timeline it should be visible where bottlenecks and long wait times worth fixing are. At this time I don't have a complete clear plan on this, though.
Still here? Cool :) If you have any though or ideas for how to use the data we collect and visualize as a valuable source for the performance optimization surgery please feel free to share them here. More on how the timeline data are produced check bellow.
How it works
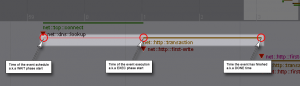
This event track on the image is produced with a special code instrumentation. To get for instance "net::http::transaction" traces, following 3 places of the code have been instrumented (in blue):
1. WAIT - record time when an http transaction is scheduled:
nsresult
nsHttpTransaction::Init(uint32_t caps,
                        nsHttpConnectionInfo *cinfo,
                        nsHttpRequestHead *requestHead,
                        nsIInputStream *requestBody,
                        bool requestBodyHasHeaders,
                        nsIEventTarget *target,
                        nsIInterfaceRequestor *callbacks,
                        nsITransportEventSink *eventsink,
                        nsIAsyncInputStream **responseBody)
{
    MOZ_EVENT_TRACER_COMPOUND_NAME(static_cast<nsAHttpTransaction*>(this),
                                   requestHead->PeekHeader(nsHttp::Host),
                                   requestHead->RequestURI().BeginReading());

    MOZ_EVENT_TRACER_WAIT(static_cast<nsAHttpTransaction*>(this),
                          "net::http::transaction");
2. EXEC - record time when the transaction first comes to an action, it is the time it gets a connection assigned and starts it's communication with the server:
void
nsHttpTransaction::SetConnection(nsAHttpConnection *conn)
{
    NS_IF_RELEASE(mConnection);
    NS_IF_ADDREF(mConnection = conn);

    if (conn) {
        MOZ_EVENT_TRACER_EXEC(static_cast<nsAHttpTransaction*>(this),
                              "net::http::transaction");
    }
3. DONE - record time when the transaction has finished it's job by completing the response fetch:
nsHttpTransaction::Close(nsresult reason)
{
    LOG(("nsHttpTransaction::Close [this=%x reason=%x]\n", this, reason));

    ...

    MOZ_EVENT_TRACER_DONE(static_cast<nsAHttpTransaction*>(this),
                          "net::http::transaction");
}
The thread timeline where an event is finally displayed is the thread where EXEC code has been called on.
What is the exact definition of the WAIT and EXEC phase is up to the developer now. For me the WAIT phase is any time an operation is significantly blocked before it can be carried out, it's the time having the main performance affect we may be in particular interested in shortening. Few examples:
- time spent in a thread's event queue - duration from the dispatch to the run
- time spent waiting for an asynchronous callback such as reading from disk or network
- time waiting for necessary resources, such as an established TCP connection before an object can proceed with its job
- time spent waiting for acquirement of a lock or a monitor
How to bind a URL or any identifying info to an event
The following instrumentation is used (in red):
nsresult
nsHttpTransaction::Init(uint32_t caps,
                        nsHttpConnectionInfo *cinfo,
                        nsHttpRequestHead *requestHead,
                        nsIInputStream *requestBody,
                        bool requestBodyHasHeaders,
                        nsIEventTarget *target,
                        nsIInterfaceRequestor *callbacks,
                        nsITransportEventSink *eventsink,
                        nsIAsyncInputStream **responseBody)
{
    MOZ_EVENT_TRACER_COMPOUND_NAME(static_cast<nsAHttpTransaction*>(this),
                                   requestHead->PeekHeader(nsHttp::Host),
                                   requestHead->RequestURI().BeginReading());

    MOZ_EVENT_TRACER_WAIT(static_cast<nsAHttpTransaction*>(this),
                          "net::http::transaction");
Here the http transaction event is set a host + path of the resource it loads.
The object's this pointer, that needs to be properly cast by the developer, is what sticks all together. This is the main difference from how usual profiling tools work. Event timeline is providing a view of event chaining crossing thread and method boundaries, and not just a pure stack trace.
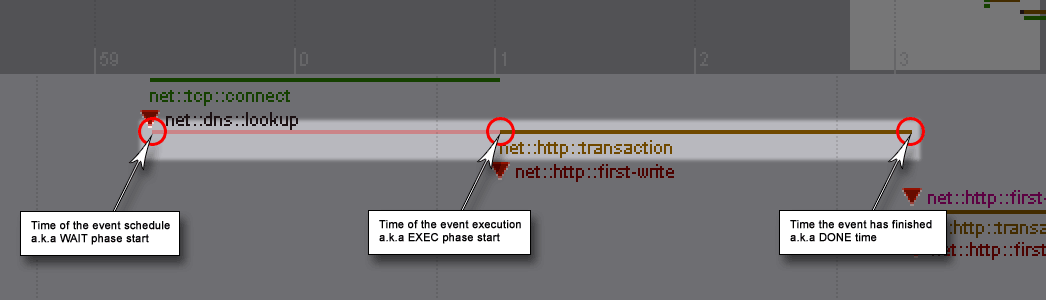
View details of a tracked event
Each event track is bound with e.g. a URL it deals with, where applicable. You can inspect the URL (the associated resource) and more details when an event is clicked on:
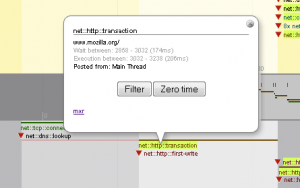 Wait between is track of the time the event spent waiting, i.e. the time the event has been scheduled and time of the execution start, both since the time tracking has been turned on. The number in parentheses is simply the wait phase duration.
Execution is track of time spent by execution, i.e. when the intended job it self has started and when it has actually finished. The parenthesized number is how long the job execution took.
Posted from is name of the thread the event has been scheduled at.
The Filter button is used to quickly filter this particular event plus it's sister events out. How it work is described bellow.
The Zero time button is used to shift the "time 0.000" of the timeline to the start time of the inspected event, so that you can inspect recorded timing of other events relative to this one particular.
mxr link will open results of search for the event name in the code. This way you can quickly inspect how this event timing is actually instrumented and collected right in the code.
Filtering timeline events
You can filter events using two filtering functions:
- By type of an event (e.g. "net::nttp::transaction", "docshell::pageload" etc.)
- By name of a resource an event has been associated with (e.g. "www.mozilla.org", "/favicon.ico" etc...)
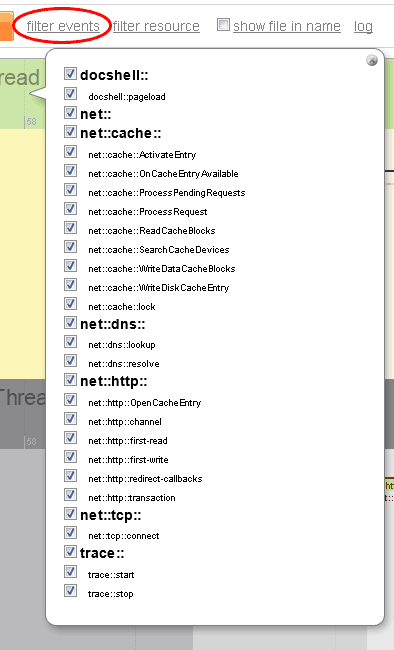
Filter by type - currently there are following event types so far implemented (instrumented). Yyou get this check box list after the tracer run when you click filter events at the top bar:
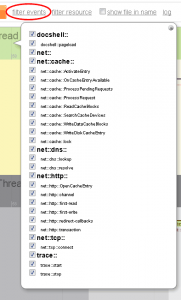 Each event has a namespace, e.g. for "net::http::transaction" the namespaces are "net::" and "net::http::". You can turn on or off the whole set of events in a namespace easily. Currently there are only "net::" and "docshell::" top level namespaces worth mentioning.
Filtering by resource, i.e. usually the URL a particular event or set of events have been bound to, is also possible when you click filter resource:
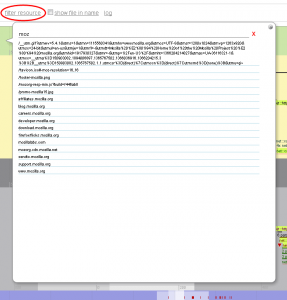
You can enter the filter string manually or use the provided autocomplete. The by-the-resource filtering works as follows:
1. we inspect whether the string set as the filter is a substring of the event resource string
2. we inspect whether the event resource string is a substring of the string set as the filter
If one of these conditions passes, we display the event, otherwise, we hide it.
This way when you enter "http://www.mozilla.org/favicon.ico" as a filter, you see the http channel and transaction for this resource load, as well as any DNS and TCP connection setups related to "www.mozilla.org".
How to use about:timeline your self
- Create an optimized build of Firefox with
--enable-visual-event-tracer configure option
- Install about:timeline extension
- Run Firefox
- Go to about:timeline
- Press the orange [ Start ] button, you get the message the trace is running
- Proceed with your intended actions, e.g. a page load, and let it finish
- Return to about:timeline tab and press the [ Stop ] button
- Wait a little to get your events timeline details
So, here it is. It's a work in progress tho. I'll keep updates.