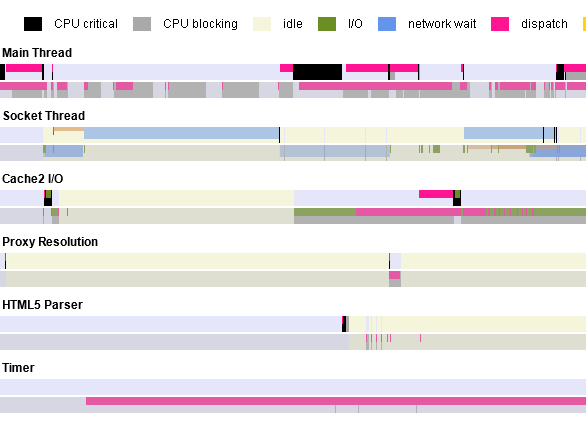
Backtrack aims to show a complete code path flow from any point back to its source, crossing asynchronous callbacks, threads, processes, network requests, timers and any kind of implementation specific queuing plus capturing any I/O or mutex blockade. The ‘critical flow execution path’ is put to a context of all the remaining concurrent execution flows. It’s then easy to examine how the critical flow is blocked and delayed by concurrent tasks.
The work is tracked in this bug, where you also find patches and build instructions. There is also an add-on that, in Backtrack enabled builds, allows you to view actual captured data.
Click the screenshot bellow to view an interactive preview. It’s capture of load of my blog main page till the first-paint notification (no e10s and no network predictor to demonstrate the capture capabilities.)
Backtrack combines*) Gecko Profiler and Task Tracer.
Gecko Profiler (PSP) provides instrumentation (already spread around the code base) to capture static call stacks. I’ve enhanced the PSP instrumentation to also capture objects (i.e. 'this' pointer value) and added a simple base class to easily monitor object life time (classes must be instrumented.)
Task Tracer (TT) on the other hand provides a generic way to track back on runnables – but not on e.g. network poll results, network requests or implementation specific queues. It was easy to add a hook into the TT code that connects the captured object inter-calls with information about runnables dispatch source and target.
The Backtrack experimental patch:
- Captures object lifetime (simply add
ProfilerTracked<class Derived>as a base class to track the object lifetime and class name automatically) - Annotates objects with resource names (e.g URI, host name) they work with at run-time
- Connects stack and object information using the existing
PROFILER_LABEL_FUNCinstrumentation recordingthispointer value automatically ; this way it collects calls between objects
- Measures I/O and mutex wait time ; an object holding a lock can be easily found
- Sticks receipt of a particular network response exactly to its actual request transmission (here I mainly mean HTTP but also applies to
connect()and DNS resolution) - Joins network polling “ins” and “outs”
- Binds code-specific queuing and dequeuing, like our DNS resolver, HTTP request queues. Those are not just ‘dispatch and forget’ like nsIEventTarget and nsIRunnable but rather have priorities, complex dequeue conditions and may not end up dispatched to just a single thread. These queues are very important from the resource scheduling point of view.
Followups:
- IPC support, i.e. cross also processes
- Let the analyzes also mark anything ‘related’ for achieving a selected path end (e.g. my favorite first-paint time and all CSS loads involved)
- Probably persist the captured raw logs and allow the analyzes be done offline
Disadvantages: just one – significant memory consumption.
*) The implementation is so far not deeply bound to SPS and TT memory data structures. I do the capture my own – actually a third data collection, side by SPS and TT. I’m still proving the concept this way but if found useful and bearable to land in this form as a temporary way of collecting the data, we can optimize and cleanup as a followup work.
