Few weeks ago I've published Mozilla Log Analyzer (logan). It is a very helpful tool itself when diagnosing our logs, but looking at the log lines doesn't give answers about what's wrong or right with network requests scheduling. Lack of other tools, like Backtrack, makes informed decisions on many projects dealing with performance and prioritization hard or even impossible. The same applies to verification of the changes.
Hence, I've added a simple network diagnostics to logan to get at least some notion of how we do with network request and response parallelization during a single page load. It doesn't track dependencies, by means of where from exactly a request originates, like which script has added the DOM node leading to a new request (hmm... maybe bug 1394369 will help?) or what all has to load to satisfy DOMContentLoaded or early first paint. That's not in powers of logan right now, sorry, and I don't much plan investing time in it. My time will be given to Backtrack.
But what logan can give us now is a breakdown of all requests being opened and active before and during a request you pick as your 'hero request.' May tell you what the concurrent bandwidth utilization was during the request in question, or what lower priority requests have been scheduled, been active or even done before the hero request. What requests were blocking the socket where your request was finally dispatched on, and so on...
To obtain this diagnostic breakdown, use the current Nightly (at this time its Firefox 57) and capture logs from the parent AND also child processes with the following modules set:
MOZ_LOG=timestamp,sync,nsHttp:5,cache2:5,DocumentLeak:5,PresShell:5,DocLoader:5,nsDocShellLeak:5,RequestContext:5,LoadGroup:5,nsSocketTransport:5
(sync is optional, but you never know.)
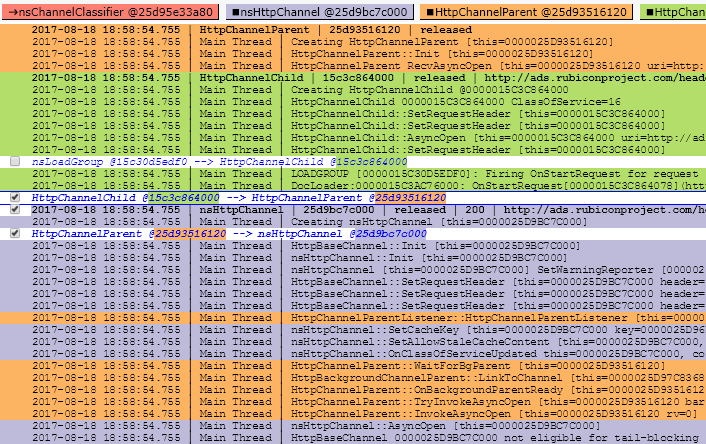
Make sure you let the page you are analyzing to load, it's OK to cancel too. It's best to close the browser then and only after that load all the produced logs (parent + children) to logan. Find your 'hero' nsHttpChannel. Expand it and then click its breadcrumb at the top of the search results. There is a small [ diagnose ] button at the top. Clicking it brings you to the breakdown page with number of sections listing the selected channel and also all concurrent channels according few - I found interesting - conditions.
This all is tracked on github and open to enhancements.