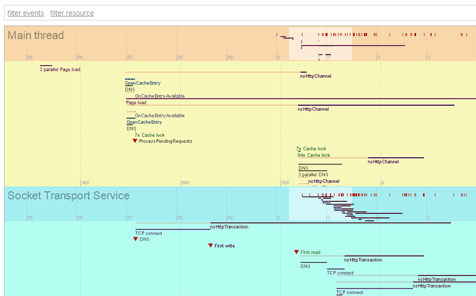
Mozilla puts a lot of effort to make Firefox faster and smoother. There is a lot of work made to find and optimize places of the code. However, I can see that sometimes developers are a bit guessing what to actually fix. I'm also part of this effort, so I decided to create a tool that would help with performance optimizations - a visualizer of all internal operations.
Profilers are nice but cannot always tell you well why UI of your app has been stuck for 2 seconds without an obvious reason.
In software so complex as Mozilla Platform and Firefox are a traditional profiler may not be able to help at all. Lot of events are being cross-posted between event queues and a lot of operations are asynchronous - i.e. w/o an immediate result. To find out what is actually slow is then hard.
My tool, on the other hand, can show you a pretty timeline with all events that have happened during Firefox run, what allows you to see where Firefox waits for a result too long ... and also why.
All the work is tracked in Mozilla bug 729182.
Click the screen shot to open the visualization tool real-time example.
(The example log is a load of edition.cnn.com web site)
