Automatically attaching child and test-spawned Firefox processes in Visual Studio IDE

Did you ever dream of debugging Firefox in Visual Studio with all its child processes attached automatically?  And also when being started externally from a test suit like mochitest or browsertest?  Tired of finding the right pid and time to attach manually?  Here is the solution for you!

Combination of the following two extensions to Visual Studio Community 2015 will do the trick:

  1. Spawned Process Catcher X - attaches automatically to all child processes the debugee (and its children) spawns
  2. Entrian Attach - attaches the IDE automatically to an instance of a process spawned FROM ANYWHERE, e.g. when running tests via mach where Firefox is started by a python script - yes, magic happens ;)

Spawned Process Catcher X works automatically after installation without a need for any configuration.

Entrian Attach is easy to configure: In the IDE, in the main menu go to TOOLS/Entrian Attach: Configuration..., you'll get the following window:

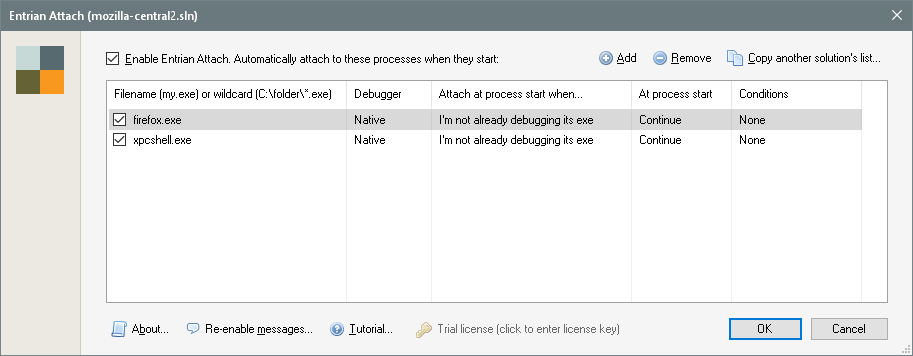
UPDATE: It's important to enter the full path for the executable.  The Windows API for capturing process spawning is stupid - it only takes name of an executable, not a full path or wildchars.  Hence you can only specify names of executable files you want Entrian Attach to automatically attach to.  Obviously, when Visual Studio is running with Entrian Attach enabled and you start your regular browser, it will attach too.  I've added a toolbar button EntrianAttachEnableDisable to the standard toolbar for a quick switch and status visibility.

Other important option is to set Attach at process start when to "I'm not already debugging its exe".  Otherwise, when firefox.exe is started externally, a shim process is inserted between the parent and a child process which breaks our security and other checks for expected pid == actual pid.  You would just end up with a MOZ_CRASH.

Note that the extension configuration and the on/off switch are per-solution.

Entrian Attach developer is very responsive.  We've already cooked the "When I'm not already debugging its exe" option to allow child process attaching without the inserted shim process, took just few days to release a fixed version.

Entrian Attach is a shareware with 10-day trial.  Then a single developer license is for $29.  There are volume discounts available.  Hence, since this is so super-useful, Mozilla could consider buying a multi-license.  Anyway, I believe it's money very well spent!

Intel Rapid Storage Technology disappears on Windows 10 and more

This started with the INACCESSIBLE_BOOT_DEVICE doom I wrote about before.  But here I want to treat the story after that.

When I solved the above mentioned problem, I ended up with 14.6 version of the driver in the system.  Everything worked well.

Until few months ago, the Intel Rapid Storage Technology UI completely disappeared from my system.  Only an empty folder under Program Files left.  Like somebody would steal it... Despite that, it still was listed as an installed software in Control Panels.

Since the UI part is important, I decided to gain it back.

But before running any SetupRST installers I rather inspected and prepared the system.  And what I found to my surprise!  The Intel's driver for the RAID storage was missing.  I was on the Microsoft's one (EhStorClass.sys).  That was very interesting thing I didn't expect.

The preparation part #1 - create a restore point!

And preparation part #2 - check that restore point is accessible from the Recovery mode.  And here it starts :)  Pressing F8 during Windows 10 boot no longer works.  Hence, on this very same machine, I created a restore USB drive.  Booted from it.  Trying to access the list of restore points - "first select a system."  What?  Aha!  The system drive didn't mount in the Recovery mode!  This means that there is something wrong with this affected system.  But I don't have intentions finding out what.

Fortunately, having a laptop with Windows 10 helped here.  That laptop didn't have iRST installed, ever.  Creating a restore drive on a different machine and booting back on the ill machine makes the list of restore points visible.  Now I can proceed.

I decided to install only the iRST UI.  As reported in the original blog post comments, 14.0.0.1143 version is considered safe to install regarding the INACCESSIBLE_BOOT_DEVICE error.  Hence, I downloaded the setup from Intel.

Running it started to complain that iRST was already installed.  I exited the setup and uninstalled the iRST using Control Panels.  Then restarted with fingers crossed.  And the system... booted!  And the Microsoft's driver didn't move a bit.

Next step.  Running the setup again, now it complains that there is a newer Intel Rapid Storage driver, version 14.6.x.x.  If it's there and it used to work, then why not to keep it?

Hence, this time I run SetupRST with -Nodrv command line argument to don't install the driver.  According to my understanding, it should only install the missing UI.  Setup installs, asks for restart.  I do it, and the system... still boots!

The Intel Rapid Storage Technology UI is there after boot, as used to be!  There is also still the Microsoft driver.  The iRST UI works with it as expected and is also able to check the volume for errors.  Nice.

But somehow I'd rather have iRST UI, the service and the driver from one company.  One never knows if when changing the volume parameters like changing the drives, enlarging etc would break in any bad combination.

Hence, I run SetupRST again, no arguments.  It asks for either uninstall or repair.  I choose repair.  It does its job, asks for reboot.  I do it, and the system... yes, still boots :)

The final result: I have both the iRST driver and the iRST UI back.
User interface version:  14.0.0.1143
Driver version:  14.6.0.1029

This seems to work well.  I can again see status of all volumes and disks, and hopefully also manage volumes safely as before.

I hope this may help anyone experiencing iRST UI being mysteriously ripped off the Windows 10 system.

Moz logging (former NSPR logging) file now has a size limit option

There are lot of cases of mainly networking issues rare enough to reproduce making users have their Firefox run for long hours to hit the problem.  Logging is great in bringing the information to us when finally reproduced, but after few hours the log file can be - well - huge.  Easily even gigabytes.

But now we have a size limit, all you need to do:

Adding rotate module to the list of modules will engage log file size limit:

MOZ_LOG=rotate:200,log modules...

The argument is the limit in megabytes.

This will produce up to 4 files with names appended a numbering extension, .0, .1, .2, .3.  The logging back end cycles the files it writes to while sum of these files' sizes will never go over the specified limit.

The patch just landed on mozilla-central (version 51), bug 1244306.

Note 1: the file with the largest number is not guarantied to be the last file written.  We don't move the files, we only cycle.  Using the rotate module automatically adds timestamps to the log, so it's always easy to recognize which file keeps the most recent data.

Note 2: rotate doesn't support append.  When you specify rotate, on every start all the files (including any previous non-rotated log file) are deleted to avoid any mixture of information.  The append module specified is then ignored.

Illusion of atomic reference counting

Regardless if an object's reference counter is atomic, there is one major problem when a single RefPtr holding it is being re-assigned and read concurrently.

Here I'll explain on a simple example. Note that all the time we are in a method of a single object, Type has ThreadSafeAutoRefCnt reference counter, when talking Mozilla code-base terms:

RefPtr<Type>; local = mMember; // mMember is RefPtr<mType>, holding an object

And another piece of code then, on a different thread:

mMember = new Type(); // mMember's value is rewritten with a new object

Usually, people believe this is perfectly safe. But it's far from it. Just break this to actual atomic operations and put the two threads side by side:

Thread 1

local.value = mMemeber.value;
/* context switch */
.
.
.
.
.
.
local.value->AddRef();

Thread 2

.
.
Type* temporary = new Type();
temporary->AddRef();
Type* old = mMember.value;
mMember.value = temporary;
old->Release();
/* context switch */
.

Similar for clearing a member (or a global, when we are here) while some other thread may try to grab a reference to it:

RefPtr<type>; service = sService; // sService is a RefPtr
if (!service) return; // service being null is our 'after shutdown' flag

And another thread doing, usually during shutdown:

sService = nullptr; // while sService was holding an object

And here is what actually happens:

Thread 1

local.value = sService.value;
/* context switch */
.
.
.
.
local.value->AddRef();

Thread 2

.
.
Type* old = sService.value;
sService.value = nullptr;
old->Release();
/* context switch */
.

And where is the problem? Clearly, if the Release() call on the second thread is the last one on the object, the AddRef() on the first thread will do its job on a dying or already dead object, not talking about further access to a bad pointer.

The only correct way is to have both in and out assignments protected by a mutex or ensure that anyone cannot be trying to grab a reference from a globally accessed RefPtr when it's being finally released or just being re-assigned. The latter may not always be easy or even possible.

Anyway, if somebody knows how to solve this universally without using an additional lock, I would be interested!

Backtrack meets Gecko Profiler

Backtrack is about to be a new performance tool, focused on revealing and solving scheduling and delay problems.  Those are big offenders of performance, very hard to track, and hidden from conventional profilers.

To find out how long and what all has to happen to reach a certain point - an objective, just add a simple instrumentation marker.  When hit during run, it's added to a list you can then pick from and start tracing to its origin.  Backtrack follows from the selected objective back to the originating user input event that has started the whole processing chain.

The walk-back crosses runnables and their wait time in thread event queues, but also network requests and responses, any code specific queues such as DOM mutations, scheduled reflows or background JS parsing 1), monitor and condvar notifications, mutex acquirements 2), and disk I/O operations.

Visually the result is a single timeline - we can call it a critical path - revealing wait, network and CPU times as distinct intervals involved in reaching solely the selected objective.  Spotting mainly dispatch wait delays is then very easy.  The most important and new is that Backtrack tells you what other operations or events block (makes the critical path wait) and where from have been scheduled.  And more importantly, it recognizes which of them are (or are not) related to reaching the selected objective.  Those not related are then clear candidates for rescheduling.

To distinguish related and unrelated operations Backtrack captures all sub-tasks that are involved in reaching the selected objective.  Good example is the page first paint time - actually unsuppress of painting.  First paint is blocked by loading more than one resource, the HTML and head referenced CSS and JS.  These loads and their processing - the sub-tasks - happen in parallel and only completion of all of them unsuppresses the painting (said in a very simplified way, of course.)  Each such sub-task's completion is marked with an added instrumentation.  That creates a list of sub-objectives that are then added to the whole picture.

Screen shot of how Backtrack is integrated to the Gecko Profiler Cleopatra web UI

Future improvements:

  • Backtrack could be used in our perfomance automation.  Except calculation of time between an objective and its input source event, it can also calculate CPU vs dispatch delays vs network response time.  It could also be able to filter out code paths clean of any outer jitter.
  • Indeed, networking has strong influence to load times.  Adding more detailed breakdown and analyzes how well we schedule and allocate network resources is one of the next steps.
  • Adding PCAPs or even let Backtrack capture network activity like Wireshark directly from inside Firefox and join it with the Gecko Profiler UI might help too.

The current state of Backtrack development is a work in active progress and is not yet available to users of Gecko Profiler.  There are patches for Gecko, but also for the Cleopatra UI and the Gecko Profiler Add-on.  The UI changes, where also the analyzes happens, are mostly prototype-like and need a clean up.  There are also problems with larger memory consumption and bigger chances to hit OOMs when processing the captured data with Backtrack captured markers.


1) code specific queues need to be manually instrumented
2) with ability to follow to the thread that was keeping the mutex for the time you were waiting to acquire it