Firefox enables link rel="preload" support

We enabled the link preload web feature support in Firefox 78, at this time only at Nightly channel and Firefox Early Beta and not Firefox Release because of pending deeper product integrity checking and performance evaluation.

What is "preload"

Web developers may use the the Link: <..>; rel=preload response header or <link rel="preload"> markup to give the browser a hint to preload some resources with a higher priority and in advance.

Firefox can now preload number of resource types, such as styles, scripts, images and fonts, as well as responses to be later used by plain fetch() and XHR. Use preload in a smart way to help the web page to render and get into the stable and interactive state faster.

Don't misplace this for "prefetch". Prefetching (with a similar technique using <link rel="prefetch"> tags) loads resources for the next user navigation that is likely to happen. The browser fetches those resources with a very low priority without an affect on the currently loading page.

Web Developer Documentation

There is a Mozilla provided MDN documentation for how to use <link rel="preload">. Definitely worth reading for details. Scope of this post is not to explain how to use preload, anyway.

Implementation overview

Firefox parses the document's HTML in two phases: a prescan (or also speculative) phase and actual DOM tree building.

The prescan phase only quickly tokenizes tags and attributes and starts so called "speculative loads" for tags it finds; this is handled by resource loaders specific to each type. A preload is just another type of a speculative load, but with a higher priority. We limit speculative loads to only one for a URL, so only the first tag referring that URL starts a speculative load. Hence, if the order is the consumer tag and then the related <link preload> tag for the same URL, then the speculative load will only have a regular priority.

At the DOM tree building phase, during which we create actual consuming DOM node representations, the respective resource loader first looks for an existing speculative load to use it instead of starting a new network load. Note that except for stylesheets and images, a speculative load is used only once, then it's removed from the speculative load cache.

Firefox preload behavior

Supported types

"style", "script", "image", "font", "fetch".

The "fetch" type is for use by fetch() or XHR.

The "error" event notification

Conditions to deliver the error event in Firefox are slightly different from e.g. Chrome.

For all resource types we trigger the error event when there is a network connection error (but not a DNS error - we taint error event for cross-origin request and fire load instead) or on an error response from the server (e.g. 404).

Some resource types also fire the error event when the mime type of the response is not supported for that resource type, this applies to style, script and image. The style type also produces the error event when not all @imports are successful.

Coalescing

If there are two or more <link rel="preload"> tags before the consuming tag, all mapping to the same resource, they all use the same speculative preload - coalesce to it, deliver event notifications, and only one network load is started.

If there is a <link rel="preload"> tag after the consuming tag, then it will start a new preload network fetch during the DOM tree building phase.

Sub-resource Integrity

Handling of the integrity metadata for Sub-resource integrity checking (SRI) is a little bit more complicated. For <link rel=preload> it's currently supported only for the "script" and "style" types.

The rules are: the first tag for a resource we hit during the prescan phase, either a <link preload> or a consuming tag, we fetch regarding this first tag with SRI according to its integrity attribute. All other tags matching the same resource (URL) are ignored during the prescan phase, as mentioned earlier.

At the DOM tree building phase, the consuming tag reuses the preload only if this consuming tag is either of:

  • missing the integrity attribute completely,
  • the value of it is exactly the same,
  • or the value is "weaker" - by means of the hash algorithm of the consuming tag is weaker than the hash algorithm of the link preload tag;
  • otherwise, the consuming tag starts a completely new network fetch with differently setup SRI.

As link preload is an optimization technique, we start the network fetch as soon as we encounter it. If the preload tag doesn't specify integrity then any later found consuming tag can't enforce integrity checking on that running preload because we don't want to cache the data unnecessarily to save memory footprint and complexity.

Doing something like this is considered a website bug causing the browser to do two network fetches:

<link rel="preload" as="script" href="script1.js">
<script src="script1.js" integrity="sha512-....">

The correct way is:

<link rel="preload" as="script" href="script1.js" integrity="sha512-....">
<script src="script1.js">

Specification

The main specification is under W3C jurisdiction here. Preload is also weaved into the Fetch WHATWG specification.

The W3C specification is very vague and doesn't make many things clear, some of them are:

  • What all types or minimal set of types the browser must or should support. This is particularly bad because specifying a type that is not supported is not firing neither load nor error event on the <link> tag, so a web page can't detect an unsupported type.
  • What are the exact conditions to fire the error event.
  • How exactly to handle (coalesce) multiple <link rel="preload"> tags for the same resource.
  • How exactly, and if, to handle <link rel="preload"> found after the consuming tag.
  • How exactly to handle the integrity attribute on both the <link preload> and the consuming tag, specifically when it's missing one of those or is different between the two. Then also how to handle integrity on multiple link preload tags.

Visual Studio Code auto-complete displays MDN reference for CSS and HTML tags

Mozilla Developer Network (now MDN Web Docs) is great, probably the best Web development reference site from them all. And therefor even Microsoft defaults to us now in Visual Studio Code.

Snippet from they Release Notes for 1.38.0:

Languages

MDN Reference for HTML and CSS

VS Code now displays a URL pointing to the relevant MDN Reference in completion and hover of HTML & CSS entities:

We thank the MDN documentation team for their effort in curating mdn-data / mdn-browser-compat-data and making MDN resources easily accessible by VS Code.

Fixing adb device unauthorized in VirtualBox hosted linux

Getting either no devices listed or just unauthorized from adb devices when running adb in a virtual machine? My setup is VirtualBox running Ubuntu 18.04 LTS hosted in Windows 10 machine. Connecting one of my Android devices with Lineage 16 and running adb in the VM doesn't make the device ask for debugging authorization. When connecting with adb from the host machine, it does.

The solution is inspired by this stackoverflow post, with few modifications.

Prerequisites:

On both the host and the virtual machine make sure the version of adb is exactly the same. Otherwise the client will ask the server to restart and unexpectedly fail, when using the below provided solution.

For instance, Firefox for Android build uses internally adb version 1.0.41. But the system wide adb (up to date) in Ubuntu is 1.0.39. To download platform-tools for Windows, in my case, with that version you have to hack the URL bar a bit as there are no download links on the android site for older versions. Trial and error got me this link to get the tools with adb version 1.0.39 for Windows.

On the host machine:

  • Connect the device with USB debugging enabled, as usually
  • Don't connect it in the running VirtualBox VM
  • Run adb devices to check the host machine sees the devices, check the server has started on port 5037

On the virtual machine:

  • Make sure the adb server is not running with adb kill-server
  • Check nothing listens on the 5037 port with netstat -nao | grep :5037
  • Run socat tcp-listen:5037,fork tcp:10.0.2.2:5037 where 10.0.2.2 should be the host address as seen from the VirtualBox VM
  • Run adb devices
  • You should see the same result as on the host machine and be able to work with the device now

The trick is to simply forward the TCP traffic between the two machines and pretend a server in the VM. It can work well the other way around with any kind of direct TCP relay in Windows, any kind of port and any IP address of choice.

I wrote this more for myself to not forget till next time, but maybe it will help someone.

Firefox 57 delays requests to tracking domains

Firefox Quantum - version 57 - introduced number of changes to the network requests scheduler.  One of them is using data of the Tracking Protection database to delay load of scripts from tracking domains when possible during the time a page is actively loading and rendering - I call it tailing.

This has a positive effect on page load performance as we save some of the network bandwidth, I/O and CPU for loading and processing of images and scripts running on the site so the web page is complete and ready sooner.

Tracking scripts are not disabled, we only delay their load for few seconds when we can.  Requests are kept on hold only while there are site sub-resources still loading and only up to about 6 seconds.  The delay is engaged only for scripts added dynamically or as async.  Tracking images and XHRs are always delayed, as well as any request made by a tracking script.  This is legal according all HTML specifications and it's assumed that well built sites will not be affected regarding functionality.

To make it more clear what we exactly do for site and tracking requests, this is how scheduling roughly looks like when tailing is engaged:

Firefox Quantum Tracker Tailing OK

And here with the tailing turned off:

Firefox Quantum Tracker Tailing OFF

This is of course not without problems.  For sites that are either not well built or their rendering is influenced by scripts from tracking domains there can be a visible or even functional regression.  Simply said, some sites need to be fixed to be able to adopt this change in scheduling.

One example is Google's Page-Hiding Snippet, which may cause a web page to be blank for whole 4 seconds since the navigation start.  What happens?  Google's A/B testing initially hides the whole web page with opacity: 0.  The test script first has to do its job to prepare the page for the test and only then it unhides the page content.  The test script is dynamically loaded by the analytics.js script.  Both the analytics.js and the test script are loaded from www.google-analytics.com, a tracking domain, for which we engage the tailing delay.  As the result the page is blank until one of the following wins: 4 seconds timeout elapses or we load both the scripts and execute them.  For a common user this appears as a performance drawback and not a win.

Other example can be a web page referring an API of an async tracking script from a sync script, which obviously is a race condition, since there is no guarantee that an async script loads before a sync script.  There is a real life example of such not-well-built site using a Twitter API - window.twttr.  The twttr object is simply not there when the site's script calls on it.  An exception is thrown and the rest of the site script is not executed breaking some of the page's functionality.  That effected web page worked before tailing just because Twitter's servers were fast to respond and executed sooner than the site script using the window.twttr object.  Hence, worked only by a lucky accident.  Note that sites with such race condition issues are 100% broken also when opened in Private Browsing windows or when Tracking Protection with just the default list is turned on.

To conclude on how useful the tailing feature is - unfortunately, at the moment I don't have enough data to provide (it's on its way, though.)  So far testing was made mostly locally and on our Web Page Test internal testing infrastructure.  The effect was unfortunately just hidden in the overall noise, hence more scientific and wide testing needs to be done.


EDIT: Interesting reactions on www.bleepingcomputer.com and Hacker News.


(Note: few somewhat off-topic comments have been trashed in case you wonder why they don't appear here ; I will only accept comments bringing a benefit to discussion of this feature and its issues, thanks for understanding)

Mozilla Log Analyzer added basic network diagnostics

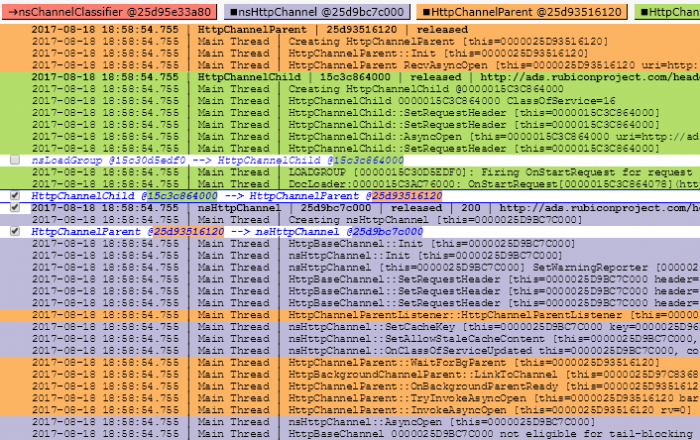
Mozilla Log Analyzer objects search results

Few weeks ago I've published Mozilla Log Analyzer (logan).  It is a very helpful tool itself when diagnosing our logs, but looking at the log lines doesn't give answers about what's wrong or right with network requests scheduling.  Lack of other tools, like Backtrack, makes informed decisions on many projects dealing with performance and prioritization hard or even impossible.  The same applies to verification of the changes.

Hence, I've added a simple network diagnostics to logan to get at least some notion of how we do with network request and response parallelization during a single page load.  It doesn't track dependencies, by means of where from exactly a request originates, like which script has added the DOM node leading to a new request (hmm... maybe bug 1394369 will help?) or what all has to load to satisfy DOMContentLoaded or early first paint.  That's not in powers of logan right now, sorry, and I don't much plan investing time in it.  My time will be given to Backtrack.

But what logan can give us now is a breakdown of all requests being opened and active before and during a request you pick as your 'hero request.'  May tell you what the concurrent bandwidth utilization was during the request in question, or what lower priority requests have been scheduled, been active or even done before the hero request.  What requests were blocking the socket where your request was finally dispatched on, and so on...

To obtain this diagnostic breakdown, use the current Nightly (at this time its Firefox 57) and capture logs from the parent AND also child processes with the following modules set:

MOZ_LOG=timestamp,sync,nsHttp:5,cache2:5,DocumentLeak:5,PresShell:5,DocLoader:5,nsDocShellLeak:5,RequestContext:5,LoadGroup:5,nsSocketTransport:5

(sync is optional, but you never know.)

Make sure you let the page you are analyzing to load, it's OK to cancel too.  It's best to close the browser then and only after that load all the produced logs (parent + children) to logan.  Find your 'hero' nsHttpChannel.  Expand it and then click its breadcrumb at the top of the search results.  There is a small [ diagnose ] button at the top.  Clicking it brings you to the breakdown page with number of sections listing the selected channel and also all concurrent channels according few - I found interesting - conditions.

This all is tracked on github and open to enhancements.